
In my blog post How Do You Measure Success, I wrote about the need to pick key business indicators that show important elements of the state of your organization. Once these key indicators are selected, the next question that needs to be answered is; “How will we report and view this key indicator?” A really good answer to this question is a Rolling 12 Month Trend report.

A Rolling 12 Month Trend report does not sound too exciting but it is a valuable tool for any organization to use to track its progress and to show trends. Essentially, it is a report that uses the running total of the values of last 12 months of an indicator. Each month, the indicator that is 13 months old is dropped from the total and the new month’s indicator value is added.
Why use this trend report rather than looking at the actual values? Well, the actual values are important for many reasons but they do not show any trends that can point to growth, flattening or decline.
Take the following chart for an example. This chart shows actual monthly indicator values over the last 8 years (the example shows revenue but it could be for any data type). Although you can see the data is choppy, it is hard to pick out any trends in where the data is going.
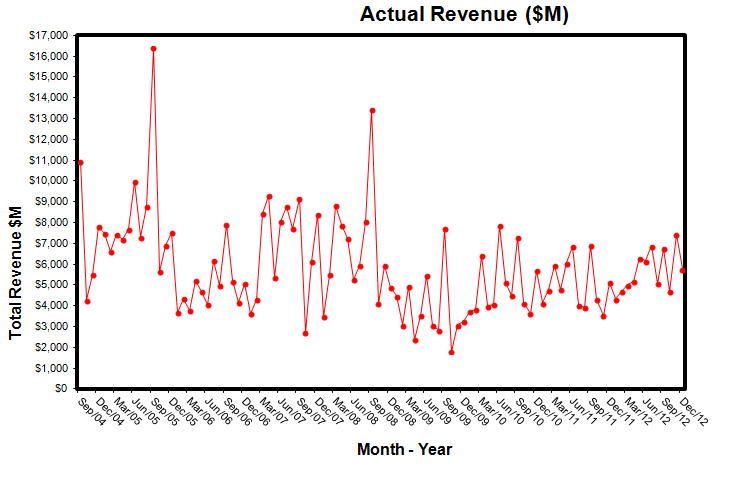
The chart below shows exactly the same data but this time in a Rolling 12 Month Trend report format.
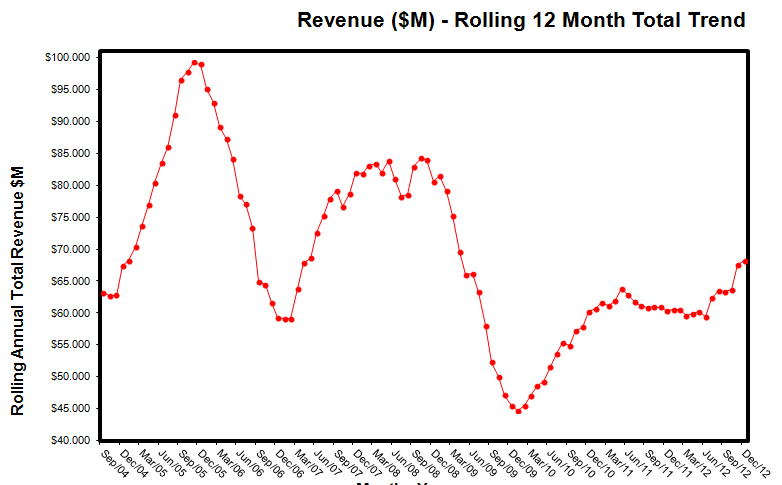
Now you can easily see where your monthly key indicator is climbing (a good thing in the case of revenue) or going sideways or falling (both really bad things for revenue).
Building your key indicators into the proper report formats is critical to understanding and running your organization. Note that the indicators and reports are not something that you get correct the first try and then never change. This is something that you should always be reviewing, questioning and tweaking as your organization adapts to the continuously changing market conditions.
Download the 12 Month Moving Average Excel template from the Business Tools page. Take this Excel Workbook and modify it to fit your reporting needs.
Nice explanation, especially the example! I have a related question. Which term would you prefer in a Dashboard? Rolling 12 Months or Moving Annual Total (R12M or MAT)? I see lots of BI books using the abbreviation MAT. Personally, I prefer R12M. Wondering what your thoughts are. Thanks!
Thanks for your question . . . I don’t have a preference for what the report is called, although R12M sounds pretty cool! The important thing is to apply it to your data and leverage this with your other indicators to identify trends and then make adjustments to your business accordingly.