
Is your business already killing it this year or have you fallen behind and now have some steep hills to climb as you get back on track?

Or maybe a better question is, do you know where you are really at?
It may be possible that you are not measuring the proper indicators or that the tools that you are using to measure your results are not giving you the “story behind the story.”
One of the secrets to business success is knowing what to measure and how to interpret the results!
For this post, I will assume that you have selected the correct indicator. So the question that we need to address is; “How will you report, view, and interpret this key indicator?”
Although there are many answers to this question, one great solution is to use a Rolling 12 Month Trend report.
Rolling 12 Month Trend
I understand that a “Rolling 12 Month Trend” report does not sound very exciting. However, it is a valuable tool that clearly shows important data trends!
Essentially, the Rolling 12 Month Trend is a report that uses the average of the last 12 months of a key indicator. Each month, the indicator that is 13 months old is dropped from the total and the new month’s indicator value is added.
Why use this trend report rather than looking at the actual values?
Well, the actual values can be important for many reasons but they do not clearly show trends that point to growth, flattening, or decline.
Take the following chart for an example.
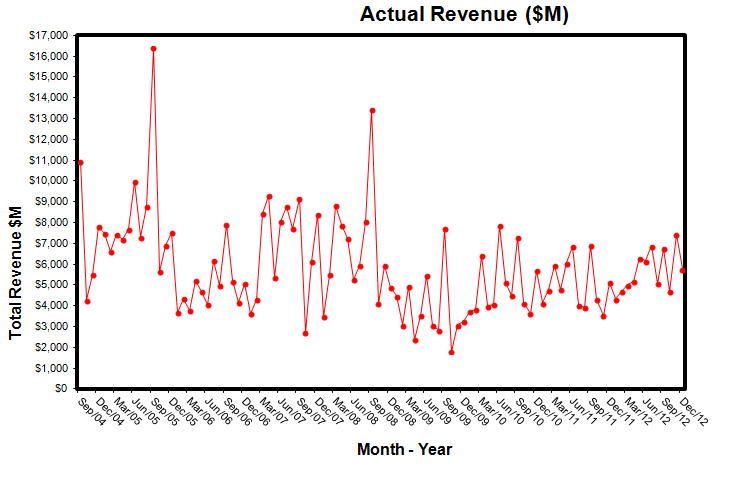
This chart shows actual monthly indicator values over an 8 year period (the example here shows revenue but it could be for any data type). The data is very choppy so it is hard to pick out any trends.
The next chart shows exactly the same data but this time in a Rolling 12 Month Trend report format.
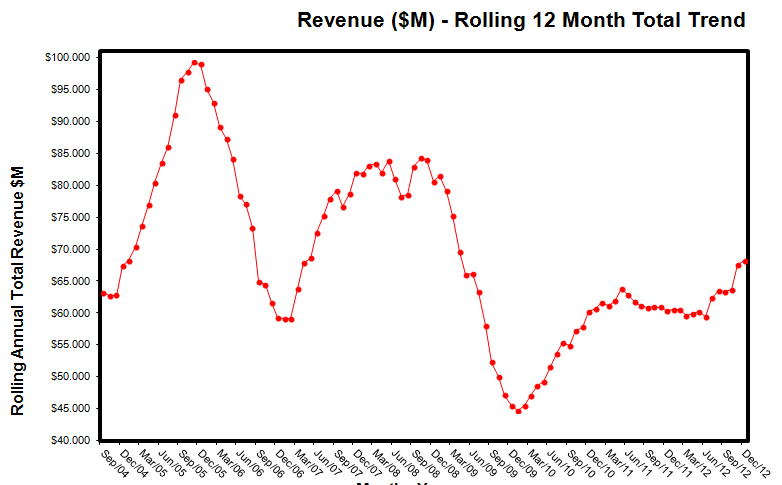
Now you can easily see where your monthly key indicator is climbing (a good thing in the case of revenue), going sideways, or falling.
Take Action
Selecting key indicators for your business is mission critical! However, properly trending key indicators is just as important to your business success!
It is also important to understand that indicators and reports are not something that you get correct the first try and then never change. This is something that you should always be reviewing, questioning, and tweaking as your organization adapts to the continuously changing market conditions.
Take action today by downloading the Rolling 12 Month Trend Excel template from the Business Tools page (Operations Engine section) and modify it to fit your business reporting needs!
Finally, review these articles for more information on this topic:
- How Do You Measure Success?
- 46 Key Indicators for Portfolio Management
- Why Destroy Your Business by Flying Blind
- How Do You Track Your Strategic Priorities?
- How to Set, Monitor and Reach Your Business Goals
- You Will Get Crushed Without Accurate Business Analytics
“. . . big picture thinking that allows leaders to pick out the meaningful trends from a welter of information around them and to think strategically far into the future.” Daniel Goleman
What is your experience with key performance indicators and reporting? Leave your comments below!
We help leaders navigate marketplace complexities and build successful and lasting business legacies.
Call or email us today for more information or to book your free business assessment:
587-227-5179
info@thinkingbusinessblog.com
Be sure to download a free copy of my new Ebook: 12 Steps to Business Transformation and to sign up at www.thinkingbusinessblog.com for weekly blog updates delivered to your inbox.
Please note: I reserve the right to delete comments that are offensive or off-topic.